

Head of U.S. Equities
S&P Dow Jones Indices

Senior Analyst, U.S. Equity Indices
S&P Dow Jones Indices

Associate Director, U.S. Equity Indices
S&P Dow Jones Indices
Introduction
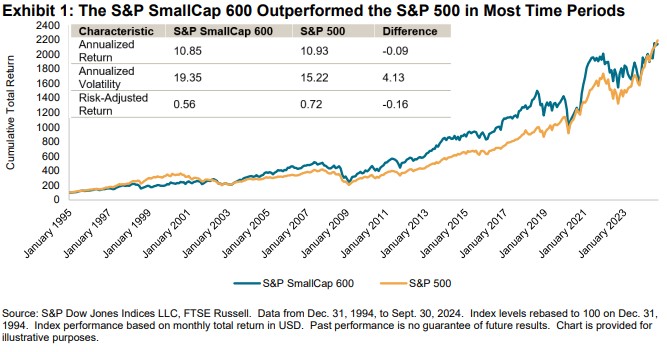
Launched Oct. 28, 1994, the S&P SmallCap 600® has provided market participants with a way to measure the small-cap U.S. equity segment for nearly 30 years. It is part of the S&P Composite 1500® with the other components being the large-cap S&P 500® and the S&P MidCap 400®. The S&P 600® serves as the basis for an ecosystem of financial products and is widely used as a benchmark for small-cap active managers.
This paper explores the following aspects of the S&P 600:
− Showing the relevance of small-cap U.S. equities to investors around the world;
− Explaining the index’s construction and the resulting impact on index characteristics and performance; and
− Showing the potential benefits of an index-based approach to U.S. small-caps.
Exhibit 1 compares the historical performance of the S&P 500 and S&P 600. Despite mega-cap equities leading the way in recent years, the S&P 600 has outperformed the S&P 500 in most periods of time.
Sign up to receive updates via email
Why Small Cap?
The S&P 600 accounts for 2% of the U.S. equity market and 1% of the global equity market, as represented by the S&P Global BMI.
The S&P 600 is larger than 76 out of 86 markets covered by S&P DJI outside the U.S., with a market capitalization greater than 71% of the S&P Developed Ex-U.S. BMI, 87% of the S&P Emerging BMI, as well as all of the S&P Frontier BMI and standalone markets. This underscores the significant opportunity that small-cap U.S. equities represent relative to foreign domestic equity markets.
Exhibit 2 shows that the S&P 600 has a market capitalization of USD 1.4 trillion, which is larger than the entire South Korean equity market and exceeds nearly all European single-country equity markets, with the exception of the U.K., France, Switzerland and Germany.

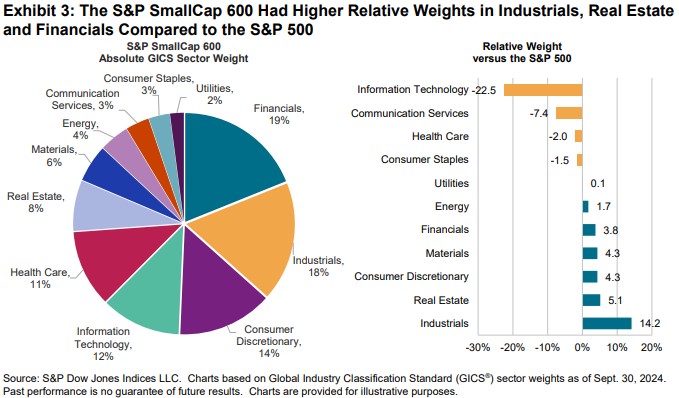
While the sheer size of the index explains why small caps are relevant to investors globally, the index’s differences in sector makeup from large-cap indices provides an interesting case as well. The S&P 600 has a higher weighting to more domestically focused and sensitive sectors such as Industrials, Financials and Real Estate, and a lower weight to segments such as Information Technology.
- Indices in This ArticleS&P SmallCap 600®
- Research – Sep 25, 2024
Bridging Value and Growth: Designing a GARP Strategy for Australia

Director, Factors and Thematics Indices
S&P Dow Jones Indices
Introduction
The debate surrounding value investing versus growth investing has been a longstanding topic in the investment community, predating the introduction of factor investing concepts. With the increasing adoption of investment style boxes, value and growth strategies have naturally evolved as extensions of asset allocation beyond the traditional market portfolio. These two characteristics serve as fundamental pillars for assessing the performance of investment strategies. For several decades, utilizing value and growth, combined with size exposure in attribution analysis, has been a prevalent method within the investment community for classifying various investment styles.
This paper will present a novel investment strategy that occupies the space between value and growth: the growth at a reasonable price (GARP) strategy, specifically from an Australian market participant’s perspective. Through a review of relevant research findings, the essence of the GARP strategy will be clarified by explaining how it differs from traditional value and growth strategies and by identifying key metrics for constructing an effective GARP strategy.
Sign up to receive updates via email
Valuation Metrics as Growth
The conventional understanding of growth investing posits that growth is the opposite of value. Traditional value investing is characterized by investing in low-valuation stocks, as defined by price-to-earnings (P/E) and price-to-book (P/B) ratios. Conversely, growth investing typically involves high-valuation stocks. This distinction originates from the Fama-French Three Factor Model, which classifies stocks based on their P/B ratios. In the Fama-French Three Factor Model, the high minus low (HML) factor represents the average return of two value portfolios minus the average return of two growth portfolios, where value portfolios consist of companies with low P/B ratios, and growth portfolios consist of those with high P/B ratios.
However, this definition of growth can be misleading, as it implies that growth is merely the opposite of value. A purely high valuation strategy does not encompass the full spectrum of growth investing. Growth investors focus on companies with growth characteristics, particularly fundamental growth indicators such as sales and earnings. They consider that growth opportunities may not be fully reflected in current prices, leading to expected excess returns on stocks in the future. Valuation is as important to growth investors as it is to value investors.
To illustrate this distinction, we can compare valuation and style indices in the U.S. market. S&P Dow Jones Indices (S&P DJI) has offered style indices for decades to measure the performance of value and growth stocks using a style box approach. The S&P 500® Pure Growth and the S&P 500 Pure Value are two indices designed to track the performance of stocks exhibiting the strongest growth and value characteristics through a style-attractiveness-weighting scheme. Both indices utilize a two-dimensional sorting method, where each security is assessed based on both value and growth metrics. Stocks are then assigned to value, blend or growth categories based on their relative rankings in these metrics. In this style box approach, value metrics are defined as a composite of book value-to-price, earnings-to-price and sales-to-price ratios, while growth metrics comprise earnings growth, sales growth and price momentum.
- Indices in This ArticleS&P World Ex-Australia GARP Index
- Research – Sep 16, 2024
The Liquidity Landscape: Trading Linked to S&P DJI Indices

Managing Director and Global Head of Index Investment Strategy
S&P Dow Jones Indices

Head of U.S. Index Investment Strategy
S&P Dow Jones Indices

Director, APAC Head of Index Investment Strategy
S&P Dow Jones Indices

Senior Lead, Capital Market Investment Strategy
S&P Dow Jones Indices
Executive Summary
From short-term traders to long-term passive investors, a healthy trading ecosystem benefits market participants by promoting price transparency, market efficiency and confidence. Updating our analysis from 2019, this paper conducts a survey of the observed volumes and implied holding periods for a global and cross-asset range of listed products tied to indices produced by S&P Dow Jones Indices (S&P DJI). The results offer perspective on the use of indices as the basis for active and passive investment strategies.
- Reported volumes across a range of products tied to S&P DJI’s indices evidence highly active usage of index-linked products.
- A globalized network of trading is associated with the S&P 500® and related indices, with potential liquidity network effects.
- We emphasize the impact and relevance of trading in S&P 500-linked products across time zones and also spotlight Australia’s growing S&P/ASX 200

Sign up to receive updates via email
The Value of Volumes
Index funds, which hardly existed 50 years ago, now play a prominent role in global financial markets, and the growth in aggregate assets under management in “passive” or index-tracking funds and portfolios may be one of the most important developments of modern financial history. As of the end of 2023, approximately USD 13 trillion of assets were in products or portfolios tracking indices provided by S&P DJI. However, while estimates of the value of assets tracking (or benchmarked to) indices are prevalent in the media, comprehensive estimates of secondary market volumes in passive vehicles can be more obscure.
This is unfortunate, because volumes can tell us how active some of the users of passive investment vehicles truly are. As well as indicating the presence of higher-frequency market participants, volume data can also give us an indication of how well a market is “policed” by arbitrageurs. Long-term passive investors may benefit from the presence of more active traders. For example, consider a hypothetical investor who purchased an exchange-traded fund (ETF) tracking the S&P 500 10 years ago expecting to earn a return that would be representative of the overall U.S. stock market and simultaneously closely comparable to the performance of an index that is reported widely in the media. Such confidence depends on two factors:
- At the time of entering or exiting their position, the investor relies on the existence of arbitrageurs who constantly monitor the relationship between the value of the ETF and the value of the fund’s holdings, with the intention to purchase or sell both simultaneously to exploit (and thereby diminish) any misalignments. If the ETF portfolio closely matches the composition of an index, and that index is associated with related liquid instruments, then this arbitrage is easier to implement. Thus, for example, liquid futures tracking the S&P 500 can help ETFs tracking the S&P 500 trade closer to their fair value.
- In between entry and exit, the investor hopes to depend on the fact that the S&P 500 and popular products based on that index receive a great deal of scrutiny from the press and the investment community. Every change in the underlying index, including adds, drops and changes to the methodology, is subject to close inspection from market participants around the globe, as are the portfolio compositions of popular ETFs tracking the same index. Such scrutiny acts to both police the ongoing link between the underlying index and its stated objective, and the link between the ETF and the index it aims to track.
- Indices in This ArticleS&P 500®Dow Jones Industrial Average®
- Research – Sep 06, 2024
Charting New Frontiers: The S&P 500® ESG Index’s Outperformance of the S&P 500

Global Head of Sustainability, Index Investment Strategy
S&P Dow Jones Indices
Introduction
The investment landscape has witnessed a significant shift toward sustainability in recent years, with growing emphasis on ESG considerations without sacrificing performance. In this environment, the S&P 500 ESG Index has emerged as a remarkable benchmark, improving ESG scores while also performing similarly to or even better than the S&P 500 since its launch, more than five years ago (see Exhibit 1).

In this reflective analysis, we embark on a journey to dissect the underpinnings of performance for the S&P 500 ESG Index, demonstrating that its success is not solely attributable to sector selection, but is also driven by factors such as selection among higher and lower ESG-scoring constituents, ESG momentum, as well as the Social pillar within ESG.
Sign up to receive updates via email
Exploration beyond Sector Weights
Launched on Jan. 28, 2019, the S&P 500 ESG Index measures the performance of securities that met certain ESG criteria, while maintaining similar overall industry group weights as the S&P 500, using S&P Global ESG Scores as the defining constituent selection characteristic.
Exhibit 2 details the long-term performance and tracking error of the S&P 500 ESG Index relative to the S&P 500.
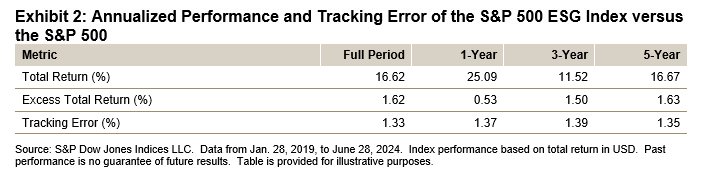
This live performance data covers an extraordinary period of contrasting market regimes, which on an almost annual basis over the five years since the index’s launch alternated between bull and bear markets. The S&P 500 ESG Index outperformed the S&P 500 over 1, 3 and 5 years while maintaining a tracking error of 1.33%, in annualized terms, since its inception. What intricate tapestry of factors contributed to this performance?
One common critique of sustainability indices is that their tendency to underweight or overweight certain sectors potentially skews performance outcomes. However, a closer examination of the S&P 500 ESG Index reveals that its outperformance has been driven by stock selection rather than sector weighting. This is illustrated in Exhibit 3 using a Brinson attribution analysis to measure the contribution of sector weighting and stock selection effects to the S&P 500 ESG Index’s excess return relative to the S&P 500. To emphasize the relative impact of sector weighting and stock selection effects, Exhibit 3 shows the proportion of the total impact (so that their absolute values sum to 100%); actual return impact is shown in the labels.
- Indices in This ArticleS&P 500 ESG Index
- Research – Aug 13, 2024
A Systematic Approach for Identifying Companies with Economic Moats

Head of Factors and Dividends
S&P Dow Jones Indices

Associate Director, Factors and Dividends
S&P Dow Jones Indices

Senior Analyst, Global Research & Design
S&P Dow Jones Indices
Introduction
Popularized by Warren Buffett, the term “economic moat” refers to a sustainable competitive advantage that enables a company to protect its market share and generate high profitability over the long term. This advantage can stem from many factors such as network effects, economies of scale, strong brand recognition and high switching costs. Due to the potential financial rewards associated with investing in companies with a wide economic moat, some market participants consider these companies highly desirable.
In April 2024, S&P DJI launched the S&P 500® Economic Moat Index, which focuses on tracking companies from the S&P 500 that have been identified as having a wide economic moat. What sets this index apart is its purely quantitative approach to identifying these companies.
A quantitative approach may offer several advantages when identifying a company’s economic moat. First, it provides an objective evaluation that eliminates subjective biases that are often associated with qualitative analysis, such as anchoring bias. Second, a quantitative approach provides a standardized method of evaluation, ensuring consistent identification across industries over time. Lastly, it enables investors to examine back-tested data, which is not possible with a qualitative analyst-driven strategy. Overall, a quantitative approach offers objectivity, consistency and the ability to analyze historical performance, making it a valuable tool in identifying economic moats.
Sign up to receive updates via email
Construction Approach
Determining a company’s economic moat requires a comprehensive approach that goes beyond relying on a single quantitative measure. Instead, it requires the use of multiple metrics that complement each other. Consistency is another critical aspect to consider, as the ability to consistently generate high returns is indicative of a wide moat. Therefore, it is important to analyze the metrics over multiple periods to provide a more accurate understanding of the strength and durability of its economic moat.


Deja un comentario