
SPIVA Latinoamérica Fin de Año 2025®

Jefe de Especialistas, Estrategia de Inversión en Índice
Índices Dow Jones del S&P

Analista cuantitativo, Estrategia de Inversión en Índices
Índices Dow Jones del S&P

Director, Estrategia de Inversión Indexada
Índices Dow Jones del S&P
Resumen
El Cuadro de Puntuación SPIVA Latinoamérica mide el rendimiento de fondos gestionados activamente en Brasil, Chile y México frente a sus respectivos índices de referencia a lo largo de diversos horizontes temporales, proporcionando estadísticas sobre tasas de bajo rendimiento, tasas de supervivencia y dispersión del rendimiento de los fondos.
Aspectos destacados de fin de año
Los índices de índice latinoamericanos aumentaron en 2025 y las tasas de bajo rendimiento variaron entre gestores activos en distintas categorías. Los fondos activos de grandes capitalizaciones en Brasil tuvieron mejor desempeño que la mayoría, con menos de la mitad de los fondos que remplearon por debajo de su índice de referencia. En todas las demás categorías, al menos la mitad de los fondos activos tuvo un rendimiento inferior en 2025. Todas las categorías tuvieron un rendimiento inferior a lo largo de un horizonte de 10 años (véase Prueba 1).
Regístrate para recibir actualizaciones por correo electrónico
México
- 2025 fue un año fuerte para las acciones mexicanas, con la S&P/BMV IRT Un aumento del 35,2% durante el año natural 2025. Alrededor de tres de cada cuatro gestores activos de fondos de renta variable de México (75,6%) tuvieron un rendimiento inferior en el horizonte anual. En periodos más largos, el rendimiento superior siguió siendo un desafío, con un 69,8%, 77,3% y 75,6% de los directivos que rindiendo por debajo del índice de referencia en periodos de 3, 5 y 10 años, respectivamente (véase el Informe 1a).
- El fondo activo mediano tuvo un rendimiento inferior al índice de referencia en un 3,0% en 2025, una tendencia que persistió con el tiempo, con fondos medianos que tuvieron un rendimiento inferior al 1,6%, 2,0% y 3,1% en los
periodos de 3, 5 y 10 años, respectivamente (véanse los Informes 3 y 5). Durante el periodo de 10 años, los directivos del top cuartelaje superaron el índice de referencia en un 0,3%. - Once again, the survival rates of active funds in Mexico remained the highest in Latin America, at 100.0%, 100.0%, 97.7% and 85.4% over the 1-, 3-, 5- and 10-year periods, respectively (see Report 2).
- Smaller funds performed significantly better than larger funds in 2025. Average returns for Mexico Equity funds were 7.1% higher on an equal-weighted basis than on an asset-weighted basis (see Reports 3 and 4).
Brazil
- Brazil’s equity market rebounded in 2025, with the S&P Brazil BMI rising 32.2% after declining in 2024 (see Report 3). Large caps, as measured by the S&P Brazil LargeCap, rose 31.7%, while mid- and small-cap companies, as measured by the S&P Brazil MidSmallCap, finished the year up 34.2%.
- In 2025, 58.0% of active Brazil Mid-/Small-Cap funds and 50.0% of Brazil Equity funds underperformed their benchmarks. It was a different story for funds holding larger stocks: slightly more than one-third (35.6%) of active Brazil Large-Cap funds underperformed their benchmarks.
- Active managers across all equity categories underperformed their respective benchmarks over the longer 10-year period ending in 2025, with underperformance rates of 90.8%, 80.5% and 84.9% in the Brazil Equity, Brazil Large-Cap and Brazil Mid-/Small-Cap fund categories, respectively (see Report 1a).
Chile
- In 2025, Chile’s equity market had an extraordinary year, with the S&P Chile BMI increasing 56.6% (see Report 3).
- A little over one-half of active Chile Equity fund managers (53.5%) underperformed the S&P Chile BMI over the one-year horizon. The underperformance rate increased over longer horizons, reaching 60.0% and 90.9% over 5- and 10-year periods, respectively (see Report 1a). Median funds outperformed the benchmark by 2.0% in 2025 but trailed by 1.6% over the longer 10-year period (see Report 5).
- Over the one-year period, smaller funds outperformed larger funds by 8.5%, with active Chile Equity funds increasing by 63.1% on an equal-weighted basis compared to 54.7% on an asset-weighted basis. Over the 10-year period ending in 2025, however, the performances converged, with equal-weighted and asset-weighted returns averaging 11.3% and 11.1%, respectively (see Reports 3 and 4).
- Over the 10-year period, top-quartile active fund managers beat the benchmark by 0.8% (see Reports 3 and 5).
Fixed Income
- Fixed income funds fared relatively poorly in 2025, with one-year underperformance rates of 83.3% and 87.4% for Brazil Corporate Bond and Brazil Government Bond funds, respectively. Over the 10-year period, underperformance rates reached 91.4% and 76.3% for Brazil Government Bond funds and Brazil Corporate Bond funds, respectively.
Market Context
While global equities were generally on the rise in 2025, Latin America stood among the highest performing regions, with the S&P Latin America BMI rising 54.0% for the year and surpassing the S&P World Index benchmark by 31.8% in U.S. dollar terms (see Exhibit 2).

- Índices en este artículoS&P BRASIL BMIS&P Chile BMI
- SPIVA – Mar 19, 2026
SPIVA Europe Year-End 2025®
Director, Index Investment Strategy
S&P Dow Jones Indices

Managing Director and Global Head of Index Investment Strategy
S&P Dow Jones Indices

Quantitative Analyst Index Investment Strategy
S&P Dow Jones Indices

Quantitative Analyst, Index Investment Strategy
S&P Dow Jones Indices
Now in its 12th year of publication in Europe, the S&P Indices Versus Active (SPIVA) Scorecards seek to inform an ongoing debate on the relative merits of active and passive investing by analyzing active fund performance across the world’s major fund markets.
European-domiciled active equity fund managers were presented with material opportunities for outperformance in 2025 as tariff turmoil and AI innovation created both winners and losers. At the same time, relatively benign tailwinds for active fixed income strategies arose from the year’s trends in credit spreads and yield curve dynamics. Overall, fewer fixed income funds underperformed than equity funds, with the contrast proving more extreme in markets closer to home (see Exhibit 1).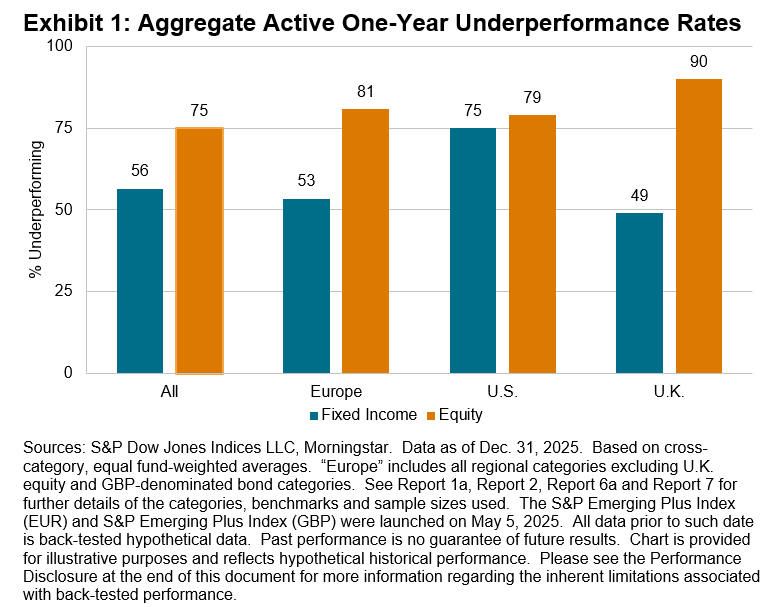
Sign up to receive updates via email
2025 Highlights
- For a third consecutive year, there were gains in almost all our fund category benchmarks and in tandem, most active funds delivered positive returns in absolute terms. However, benchmark-beating returns continued to be harder to find.
- It was another challenging year for active equity funds domiciled in Europe, with majority underperformance found in 18 out of 21 reported categories and beat rates of less than 25% in more than one-half of reported categories. Active fixed income funds had lower underperformance rates on average, but more than one-half of funds still underperformed in 7 out of 10 reported categories.
- In the category with the largest number of available funds, namely Global Equity funds denominated in euros, 71% of actively managed funds underperformed the S&P World over the full year. The equivalent statistic for U.K. pound sterling-denominated Global Equity funds was 75%.
- Narrowing to the European continent, 82% and 78% of pan-regional active equity funds denominated in euros and sterling, respectively, underperformed the S&P Europe 350®. The record of euro-focused bond managers was middling, with 48%, 54% and 57% of funds underperforming in the Government Bond, Corporate Bond and High Yield Bond euro categories, respectively.
- The U.K. stock market proved particularly grueling for active funds; 89% of funds in the U.K. Large-/Mid-Cap Equity category underperformed and so did 97% of funds in the U.K. Small-Cap Equity category. In contrast, there was majority outperformance among GBP-denominated active Corporate Bond funds, and a relatively slim majority, 59%, of active U.K. Government Bond funds lagged the category benchmark.
- Indices in This ArticleS&P Europe 350S&P Eurozone BMIS&P Global 1200S&P Poland BMIS&P United Kingdom SmallCap
- SPIVA – Mar 16, 2026
SPIVA Australia Year-End 2025®

Director, APAC Head of Index Investment Strategy
S&P Dow Jones Indices

Quantitative Analyst Index Investment Strategy
S&P Dow Jones Indices
Director, Index Investment Strategy
S&P Dow Jones Indices
The SPIVA Australia Scorecard measures the performance of actively managed funds relative to benchmarks over various time horizons, encompassing equity, real estate and bond funds, while providing statistics on outperformance rates, survivorship rates and fund performance dispersion.
2025 Year-End Highlights
Australian active managers experienced mixed fortunes in 2025. Many active equity funds, both domestic and global, struggled to match the market performance. In contrast, active A-REIT funds delivered a majority outperformance, marking their best relative results since 2013. Active bond funds had the lowest rate of underperformance among all categories, extending their streak of majority outperformance to a third consecutive year. Despite these successes, a firm majority of funds in every category underperformed over the decade ending in December 2025.
Sign up to receive updates via email
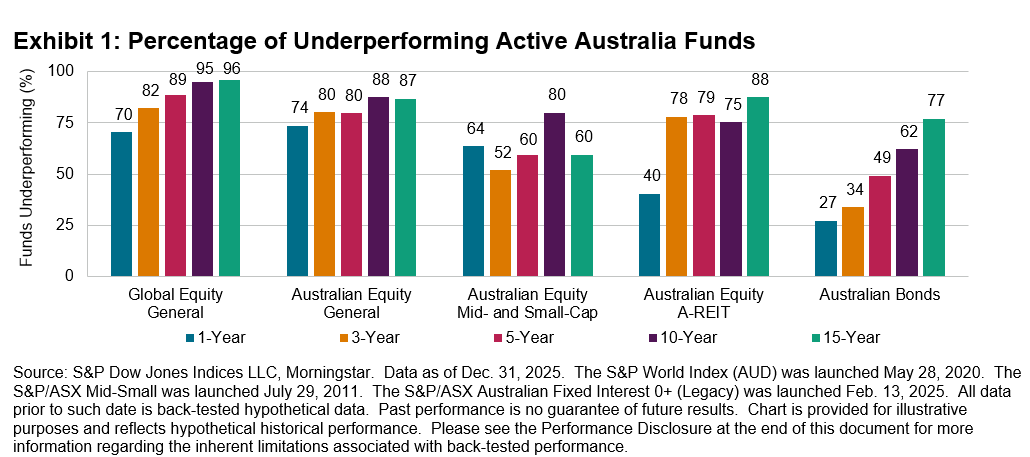
- Global Equity General Funds: Despite relatively resilient results in the first half of 2025, active funds lost ground in the second half and recorded a 70% full-year underperformance rate. These funds had an asset-weighted average return of 9.6%, versus the 13.3% gain in the S&P World Index (AUD). Underperformance rates increased for longer horizons, exceeding 95% over the 10- and 15-year periods.
- Australian Equity General Funds: The S&P/ASX 200 rose 10.3% in 2025, marking its third consecutive year of double-digit growth, while actively managed Australian Equity General funds returned 5% on an asset-weighted basis. The underperformance rate was 74%, compared with its long-term average of 60% (see Exhibit 7). Over 15 years, 87% of funds failed to beat the benchmark.
- Australian Equity Mid- and Small-Cap Funds: The S&P/ASX Mid-Small surged 21.5% in 2025, raising the hurdle for active funds. Nearly two-thirds (64%) of Australian Equity Mid- and Small-Cap funds underperformed, with an asset-weighted average return of 13.2%. Funds in this category exhibited comparatively stronger results over the long term, with 60% lagging the benchmark over the 15-year period.
- Australian Equity A-REIT Funds: While the S&P/ASX 200 A-REIT posted a healthy 9.2% gain, Australian Equity A-REIT funds delivered an asset-weighted average return of 11.7%, with 40% of funds underperforming—the lowest level since 2013. Over the 15-year period, however, 88% of funds underperformed.
- Australian Bonds Funds: Active bond funds’ relative performance improved in H2 2025 as credit spreads resumed tightening. The full-year underperformance rate was 27%, versus 46% in H1 2025, extending their low underperformance rates observed in 2024 (30%) and 2023 (26%). Funds returned 4.0% on an asset-weighted average basis, compared with 3.2% for the S&P/ASX iBoxx Australian Fixed Interest 0+ Index.
- Fund Survivorship: Liquidation rates remained moderate, averaging 4% across categories in 2025 (see Report 2). Australian Equity A-REIT funds again showed the highest liquidation rate at 7%, following 18% in Conversely, Australian Equity Mid- and Small-Cap funds recorded the highest survival rate of 97%. Attrition increased materially over longer time horizons, with 52% of funds across all categories merged or liquidated over the 15-year period.
- Indices in This ArticleS&P/ASX 200S&P Developed Ex-Australia LargeMidCapS&P/ASX Mid-SmallS&P/ASX 200 A-REIT
- SPIVA – Mar 09, 2026
SPIVA Japan Year-End 2025®
Director, APAC Head of Index Investment Strategy
S&P Dow Jones Indices
Quantitative Analyst Index Investment Strategy
S&P Dow Jones Indices
Director, Index Investment Strategy
S&P Dow Jones Indices
Since the first publication of the S&P Indices Versus Active (SPIVA) U.S. Scorecard in 2002, S&P Dow Jones Indices has been the de facto scorekeeper of the ongoing active versus passive debate. The SPIVA Japan Scorecard measures the performance of actively managed funds offered in Japan against assigned benchmarks over various time horizons, covering large-, mid- and small-cap segments, as well as international and global equity funds.
Year-End 2025 Highlights
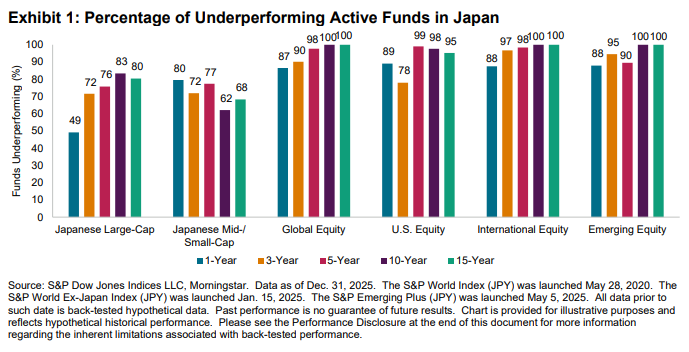
2025 proved to be challenging for active managers in Japan, with over 80% of funds underperforming their relevant benchmarks across five fund categories. The Japanese Large-Cap category was the notable exception, with a slim majority of funds outperforming—marking its best relative performance since 2017. However, long-term results remained unfavorable: across all categories, a significant majority of funds underperformed over the 15-year period ending in December 2025.
Regístrate para recibir actualizaciones por correo electrónico
- Fondos japoneses de gran capitalización: El S&P/TOPIX 150 registraron una impresionante ganancia del 25,0% en 2025, mientras que los fondos japoneses de gran capitalización gestionados activamente lograron rendimientos medios del 25,4% y 9% en bases ponderadas por activos igualitarios, respectivamente. En esta categoría, el 49% de los fondos tuvo un rendimiento inferior al índice de referencia, lo que representa la tasa de bajo rendimiento más baja desde 2017 (véase Exhibición 5). Sin embargo, las tasas de bajo rendimiento aumentaron durante periodos más largos, superando el 80% en los periodos de 10 y 15 años.
- Fondos japoneses de mediana y pequeña capitalización: Los fondos japoneses de mediana y pequeña capitalización gestionados activamente tuvieron dificultades para superar el índice de referencia en medio de su fuerte repunte, registrando una tasa de bajo rendimiento del 80%, el peor resultado desde 2014. No obstante, demostraron un mejor rendimiento relativo a largo plazo, con tasas de bajo rendimiento del 62% y 68% en los periodos de 10 y 15 años, respectivamente.
- Fondos globales de renta variable: El Índice Mundial S&P Registraron una ganancia del 7% (en términos de yenes), mientras que los fondos de Global Equity entregaron rendimientos medios del 15,0% y 13,9% en bases iguales y ponderadas por activos, respectivamente. Durante este periodo, el 87 % de los fondos de Global Equity tuvieron un rendimiento inferior al índice de referencia, mientras que el 100 % de los fondos se retrasaron en periodos de 10 y 15 años.
- Fondos de renta variable estadounidenses: Los fondos de renta variable estadounidenses con domicilio en Japón enfrentaron desafíos significativos, con un 89% de los fondos que no lograron superar el índice de referencia en 2025, el nivel más alto entre todas las categorías. Lograron un rendimiento medio ponderado por activos del 9,1%, en comparación con el S&P 500®del 17,6% en términos de yenes.
- Fondos internacionales de renta variable: Los fondos internacionales de renta variable registraron una tasa mayoritariamente de bajo rendimiento del 88%, ofreciendo un rendimiento medio ponderado por activos del 9% frente a una ganancia del 21,5% en el Índice S&P World Ex-Japón (en términos de yenes). Las tasas de bajo rendimiento generalmente aumentaron a largo plazo, alcanzando el 100% en los periodos de 10 y 15 años.
- Fondos de renta variable emergentes: Los fondos de renta variable emergente registraron una tasa mayoritariamente de bajo rendimiento del 88% frente al nuevo índice de referencia de la categoría, el S&P Emerging Plus. Estos fondos lograron un rendimiento medio ponderado por activos del 23,8%, frente a una ganancia del 9% en el S&P Emerging Plus (en términos de yenes). Las tasas de bajo rendimiento aumentaron al 100% en los periodos de 10 y 15 años.
- Financia la supervivencia: La liquidación de fondos se mantuvo moderada en general, con un 8% de los fondos activos en todas las categorías reportadas fusionados o liquidados en 2025. Los fondos emergentes de renta variable y global experimentaron las tasas de rotación más altas, superando el 5,0%. Durante un periodo de 15 años, más de la mitad de todos los fondos no lograron sobrevivir (véase el Informe 2).
Contexto del mercado
Las acciones globales tuvieron otro año sólido en 2025. Las acciones de mercados desarrollados, según el S&P World, avanzaron un 21,7% en yenes, marcando el tercer año consecutivo de ganancias superiores al 20%. Las acciones de mercados emergentes superaron —una tendencia que no se veía desde hace tiempo— con el S&P Emerging BMI registrando una impresionante subida del 31,9%.
Las acciones japonesas también se dispararon, con la S&P Japan 500 alcanzando un máximo histórico y registrando un aumento del 25,1%. El repunte estuvo impulsado por la perspectiva de crecimiento salarial y un aumento del consumo, ya que la inflación se mantuvo firmemente por encima del 2%, junto con la resiliencia de los beneficios corporativos japoneses a pesar de los aranceles estadounidenses más altos. Las políticas pro-crecimiento de la primera ministra Sanae Takaichi reforzaron el optimismo sobre el mercado de acciones, resultando en la entrada extranjera anual más fuerte desde 2013. Sin embargo, esto no fue bien recibido en el mercado de bonos; Las preocupaciones sobre el aumento del gasto fiscal combinadas con la normalización de la política del Banco de Japón pesaron mucho sobre los bonos japoneses, con el Gobierno Global Japón de iBoxx terminando un 6,3% por debajo de la lista.
Las empresas japonesas más pequeñas superaron a sus homólogas de gran capitalización. El S&P Japan MidSmallCap subió un 29,1% frente a un aumento del 25,0% en el S&P/TOPIX 150 de grandes capitalizaciones, lo que supone una desviación notable respecto a la tendencia de dominio de grandes capitalizaciones observada en años anteriores.


Deja un comentario